
People succeed in content marketing when they do a few things really well.
First, they truly understand their target customer. Second, they create content that might appeal to that target customer, knowing they may not hit the bullseye right off the bat. Third, and most importantly, they measure performance and adjust course as needed.
But to truly measure the impact of your content marketing you have to know which metrics matter.
This is particularly important when you’re just getting started. Here are five outside-the-box metrics your competition probably doesn’t know about. Measure even one or two of these and you’ll pull way ahead of them.
DVR (no, not the box in your living room) measures the ratio of direct visits to total site visits.
Why is this awesome?
Because it suggests people like what they find on your site. Why else would they navigate directly to it?
Direct traffic will measure, among other things, people who:
These are exactly the kinds of things you want people doing with your content.
Use your analytics package of choice, like Google Analytics, to pull the total direct visitors and divide that by the total site visitors over the same time period.
Pro tip: Be sure to segment the data and set goals accordingly…
You should expect your blog to have a different DVR than your service or product pages.
If you serve a local area, you might want to segment the DVR to only those visitors located within your service area.
You could even measure the change in DVR over time as you optimize a specific piece of content.
Looking for a single metric to rule them all? This is a definite contender. RVR is a simple metric and very similar to DVR: it’s the ratio of returning visitors to total visitors.
In other words: If you had 100,000 visits this month, 20,000 of those had been to your site before and 80,000 are first-time visitors, your return visitor rate is 20 percent.
Looking for a single metric to rule them all? This is a definite contender.
What’s cool about this metric is just how simple it is…
If people are coming back to the website, they obviously like what they’re finding, right?
Content marketing firm Contently says, in general, you should shoot for an RVR above 25%.
This is incredibly simple to measure. Just pick a time period in your analytics and divide total number of returning visitors by total number of visitors.
Be sure to segment this data and keep in mind external factors could affect the ratio, like active advertising campaigns.
Social shares are an obvious metric that everybody talks about, but what about measuring the number of people who email your content to a friend or print it?
First, add buttons that make it easy to email or print your content. Then create analytics events to measure every time someone clicks one.
Trevor Klein at Moz explains how to build a single metric that combines a bunch of other metrics to measure content effectiveness.
He explains how Moz uses One Metric to measure performance of blog posts by combining unique visits, thumbs ups, comments, Facebook likes, tweets, and Google +1s into a single metric.
Instead of being clobbered over the head with how badly you’re doing, you can focus on how much improvement you’re making.
That metric is then compared to the average for each post on the blog.
A post does well if it performs better than the average.
Here’s an overview of the formula:
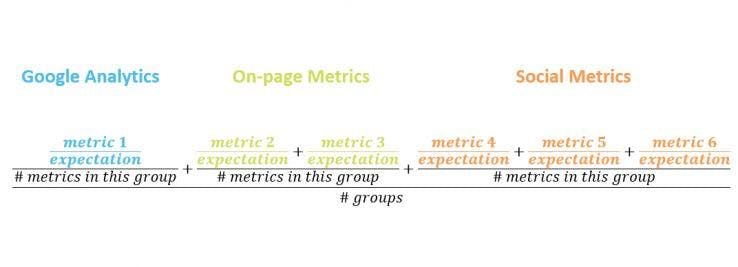
Image source: https://moz.com/blog/one-metric
We all know there’s no single metric that measures the success of content. But One Metric gives it a shot by combining multiple metrics into… you guessed it, one.
One Metric also focuses on continuous improvement because it compares each post to the average performance of previous posts.
That means instead of being clobbered over the head with how badly you’re doing starting out, you can focus on how much improvement you’re making.
Lots of manual work, right? Wrong! Like the others, this one is really easy, too.
By using a tool like Supermetrics, you can pull all the data you need from various sources into a single Google Sheet. Then all you have to do is setup these calculations in the sheet based on that data.
Brand lift is a blanket term for the impact advertising has on improving perceptions and behaviors of your brand throughout the customer journey.
It includes things like brand awareness, ad recall, consideration, favorability, purchase intent and brand interest.
As eMarketer’s David Hallerman puts it, “While clicks are useful for direct response objectives, brand marketers need to gauge more subtle metrics.”
A solid content marketing program can really increase brand lift metrics.
Historically only huge advertisers have measured brand lift, but using Google Consumer Surveys, SMBs can run their own brand lift surveys.
For $0.10 a survey you can ask people questions to gauge brand lift, such as:
Google will even let you target specific demographics and locations. For example, parents within 20 miles of downtown Cincinnati.
Get marketing insights that actually move the needle — directly in your inbox.


